Difference in elevation gain between routes - why?
-
I have planned a cycle route in 20 stages.
Using it as one continuous route by adding stops for each stage the ascent is 19237m.
I have created individual routes for each of the 20 stages the total is 9301m.
The routes on the map are the same.
Why the difference?
Which one is correct?
Thanks -
There will always be differences. The elevation profile is filtered in different ways (smoothed by a curve), so elevation gain is never an exact value. However, the difference you’re seeing — more than double — is unusually large and shouldn’t normally happen. Typically, you might see a variance of up to a few dozen percent, but not over 100%.
The filtering takes into account many parameters, and the total route length is one of them, so there will always be some discrepancy. Calculating elevation gain is not as straightforward as calculating distance, where you can simply sum the distances between all track points — for elevation, filtering is necessary, as I mentioned.
If you could share the route here, we could take a closer look, but without the actual data I can’t give you a more precise answer.
-
@Jan-Buriánek it is a very long cycle route from Ouistreham to Cannes 1400km.
I do accept ascent definition is not straightforward.
If you do have the time to look at it I would appreciate it.
Here is the one route with the 'via's, and then the 20 individual routes which should all be shared.This is the link to the route as one stage https://mapy.com/s/bonafudajo
and these are the 20 individual days
https://mapy.com/s/gavucenevo
https://mapy.com/s/rafubakude
https://mapy.com/s/pejekofula
https://mapy.com/s/jajehezofu
https://mapy.com/s/ledosasale
https://mapy.com/s/bapelajuso
https://mapy.com/s/dadasefula
https://mapy.com/s/lorebofane
https://mapy.com/s/davebunupa
https://mapy.com/s/cokudabuzo
https://mapy.com/s/jefevalolu
https://mapy.com/s/bopegesece
https://mapy.com/s/hehorebefe
https://mapy.com/s/delokababa
https://mapy.com/s/bapacamatu
https://mapy.com/s/jarovuheco
https://mapy.com/s/gegusadofu
https://mapy.com/s/kokagoveva
https://mapy.com/s/genasehape
https://mapy.com/s/gulazetekuThank you.
-
@georgewormald
I’ll take a look at it this evening. I quickly opened the overall route, and it shows 9301 m. In the original question, I understood it the other way around — that the total is greater than the sum of the individual stages.
If it’s actually the other way — that the sum of the individual stages is higher — then that’s the more likely scenario. -
The overall route is very long, and the algorithm in Mapy.com applies heavy filtering in such cases. As a result, the total ascent is unfortunately heavily underestimated.
The individual stages are optimal plans, and their elevation profiles are correct — or at least very close to reality.
So, the correct figure is the sum of the individual stages, about 19 km of ascent.The tracks are not perfectly identical (stages 6, 14, and 16 differ), but this would not significantly change the large discrepancy.
Elevation profiles are a tricky matter — every program or website will give slightly different results depending on the algorithm used.In addition, inaccuracies in terrain models also come into play — for example, bridges, tunnels, embankments, and cuttings are often not represented in the data. The elevation profile may then drop to river level or climb over a hill, while in reality the road goes straight over a bridge or through a tunnel.
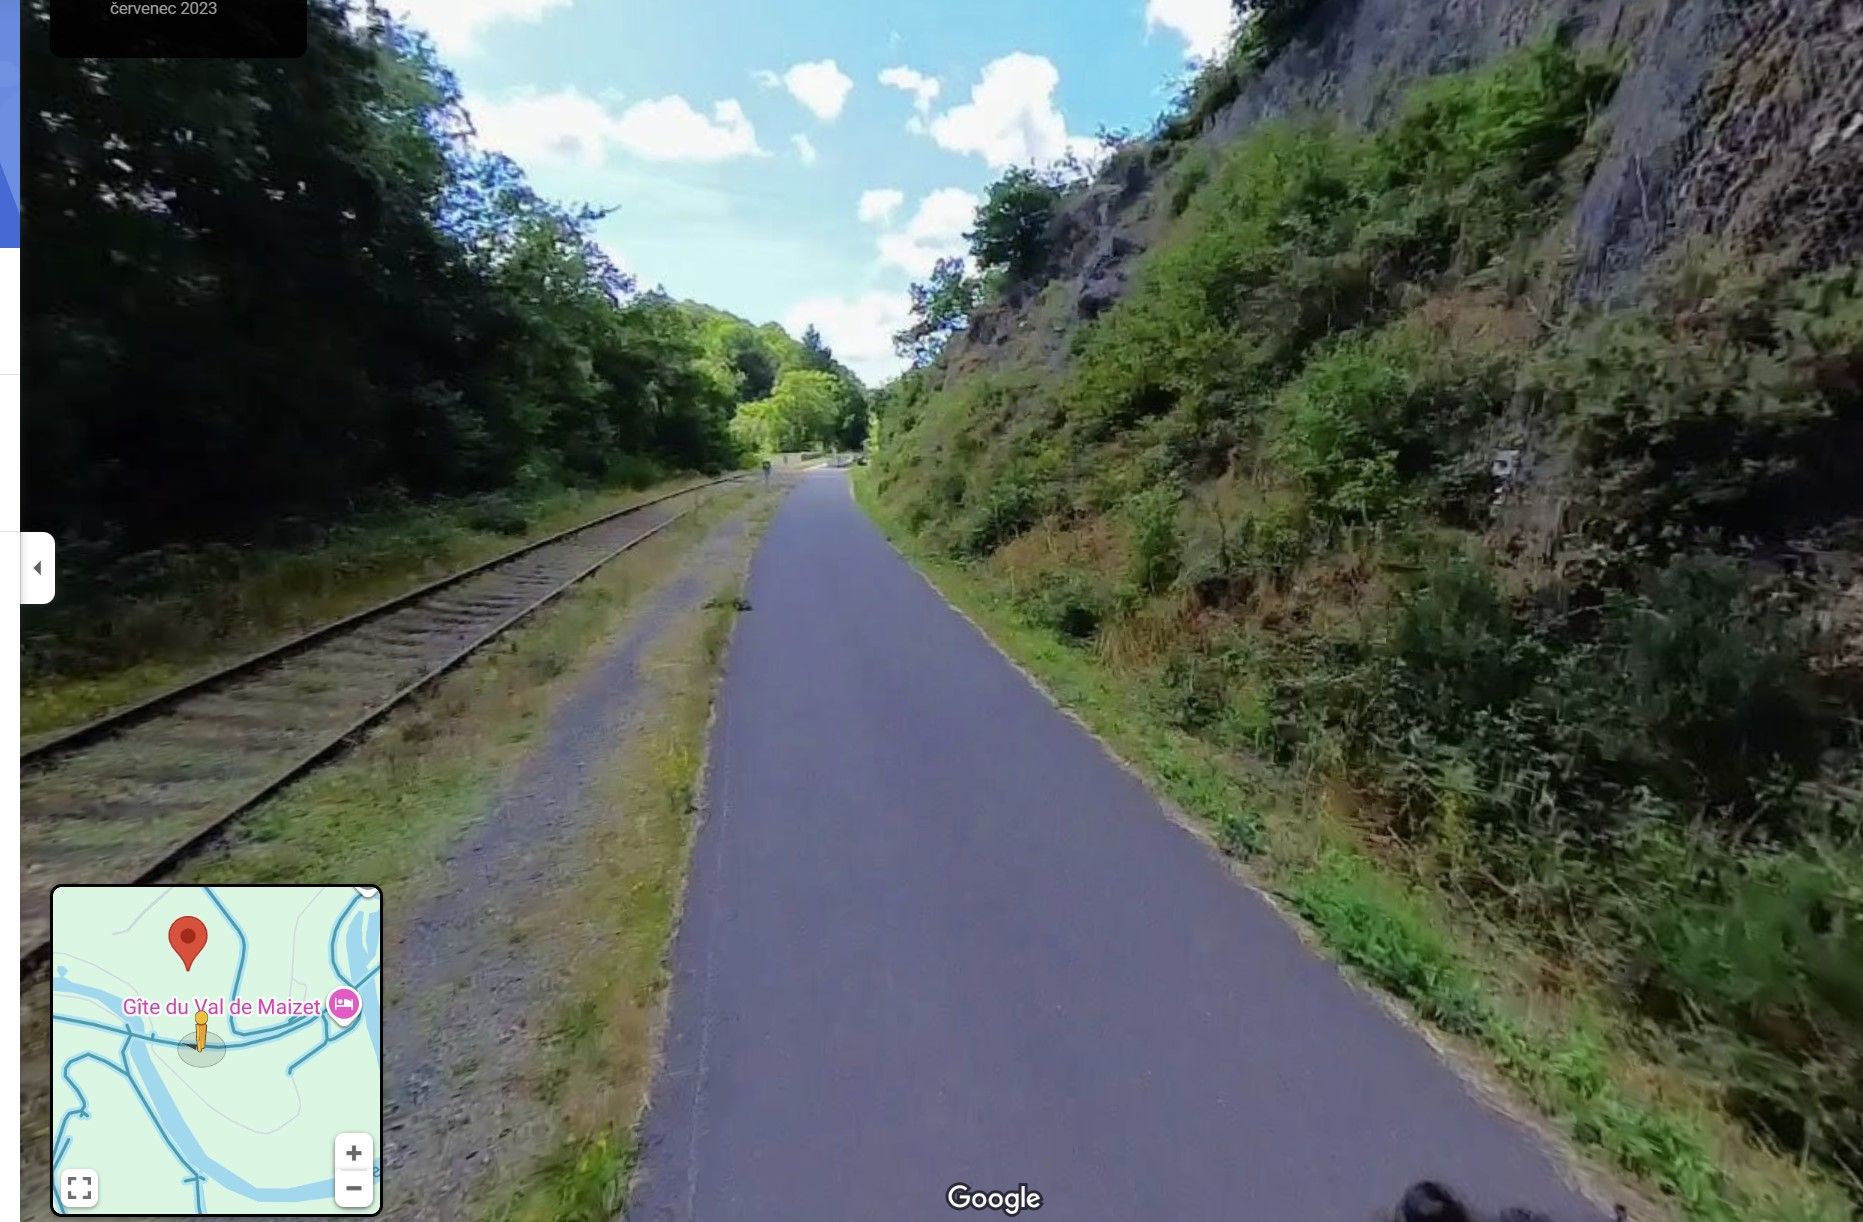
In your case, an example of this is already on the first stage about halfway along — the elevation profile rises and falls by tens of metres, but in reality it’s an inline route along the railway. See the first two pictures — a plan segment over two bridges and a Google Street View screenshot.The actual ascent values may therefore be less than those calculated by the algorithm, but in this case the difference is negligible for the whole.
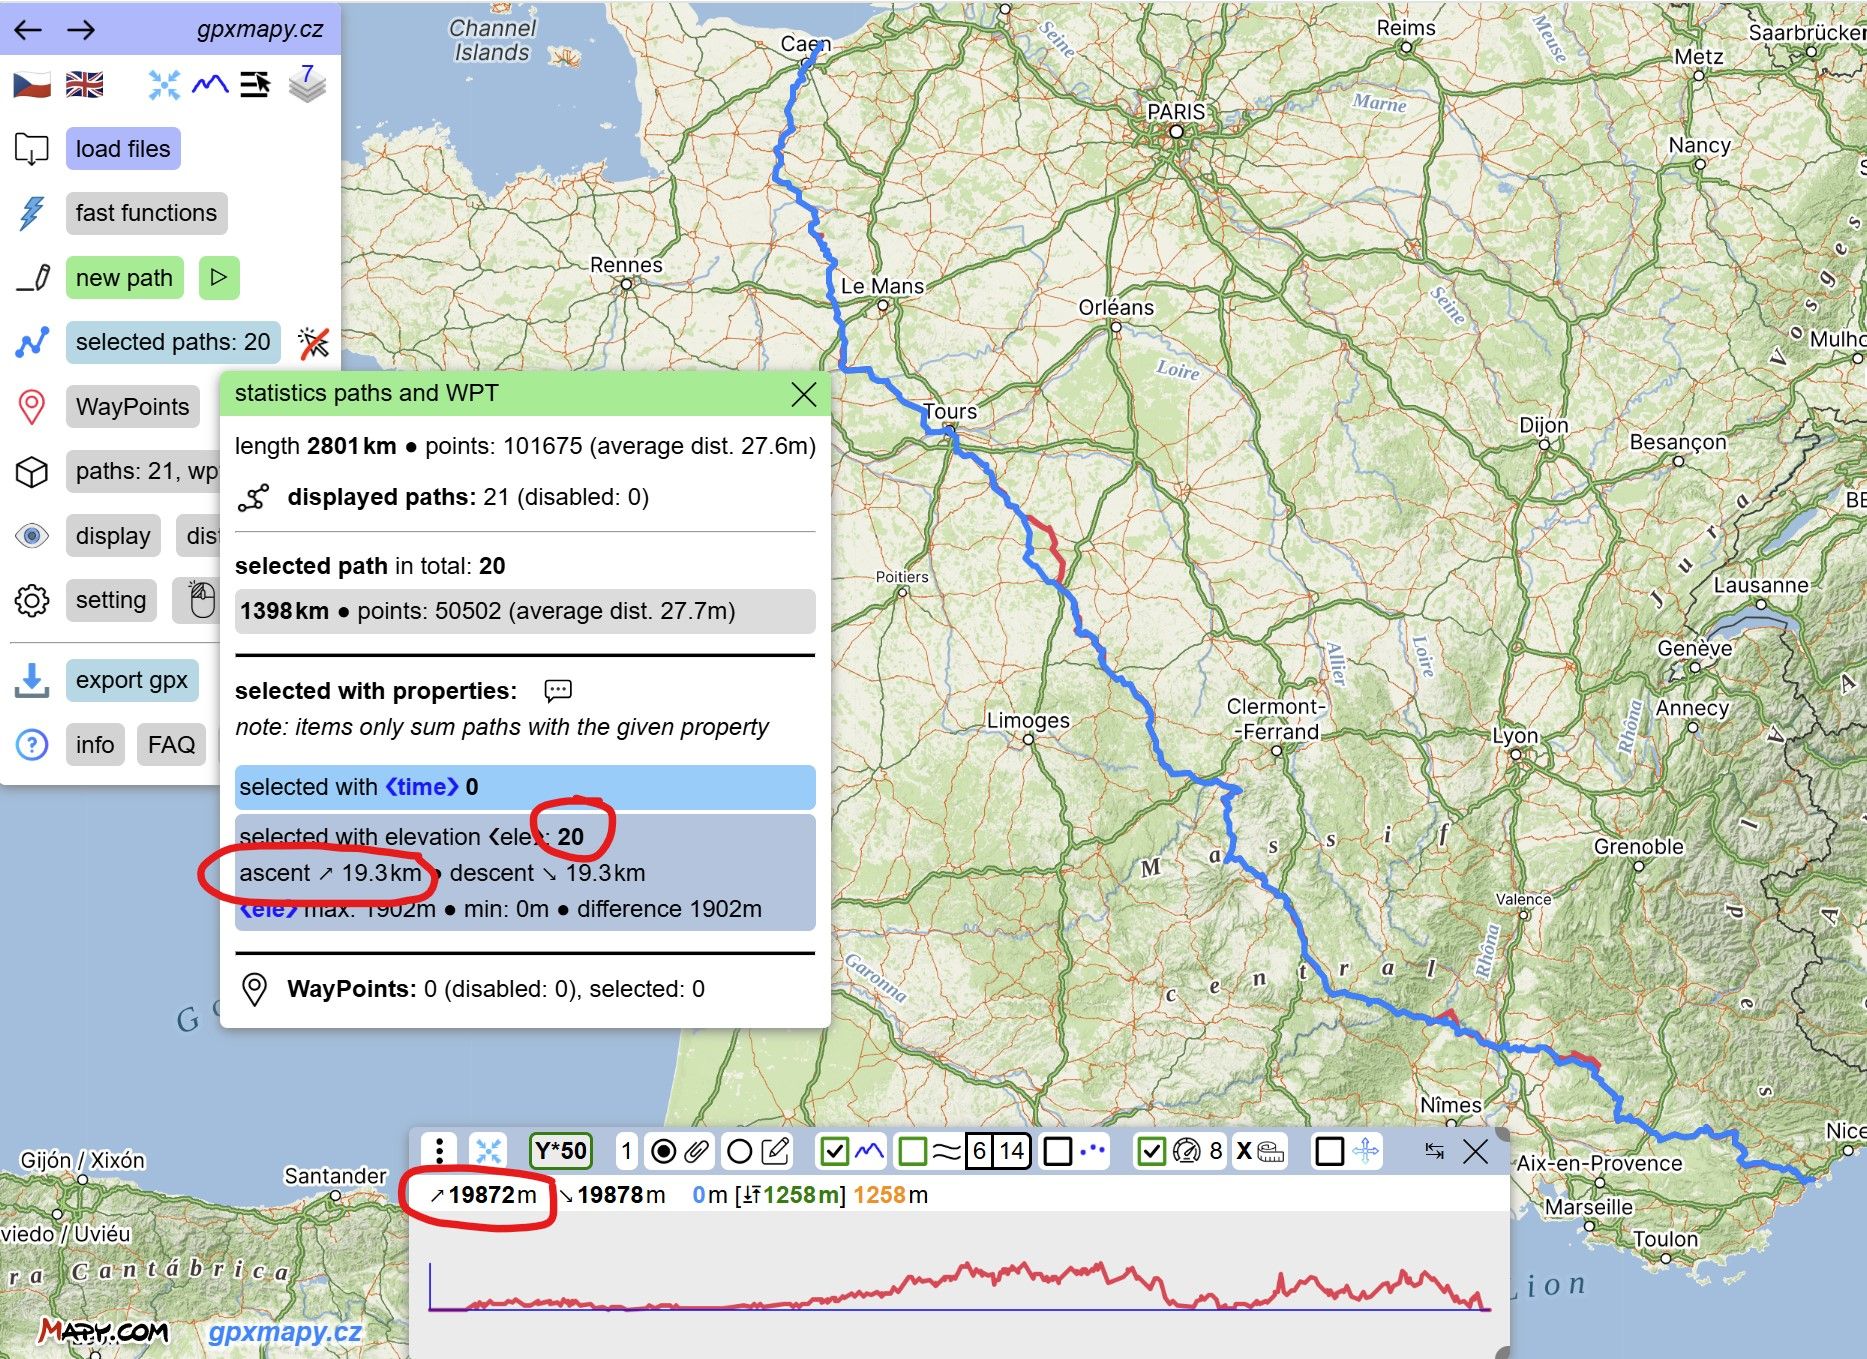
It’s safe to say that these 20 stages together have a total ascent of about 19 km.I’m also attaching a third image from the gpxmapy.cz editor, where I uploaded all exported tracks — the 20 stages plus the overall one.
There you can see the route differences mentioned. This site shows similar values for the individual stages as those shown individually on Mapy.com, and their sum can be seen in the statistics — 19.3 km. The overall track’s profile shows 19.8 km. For interest: a raw sum of all elevation changes across every point of the overall track comes to 29.7 km — which is why filtering is necessary.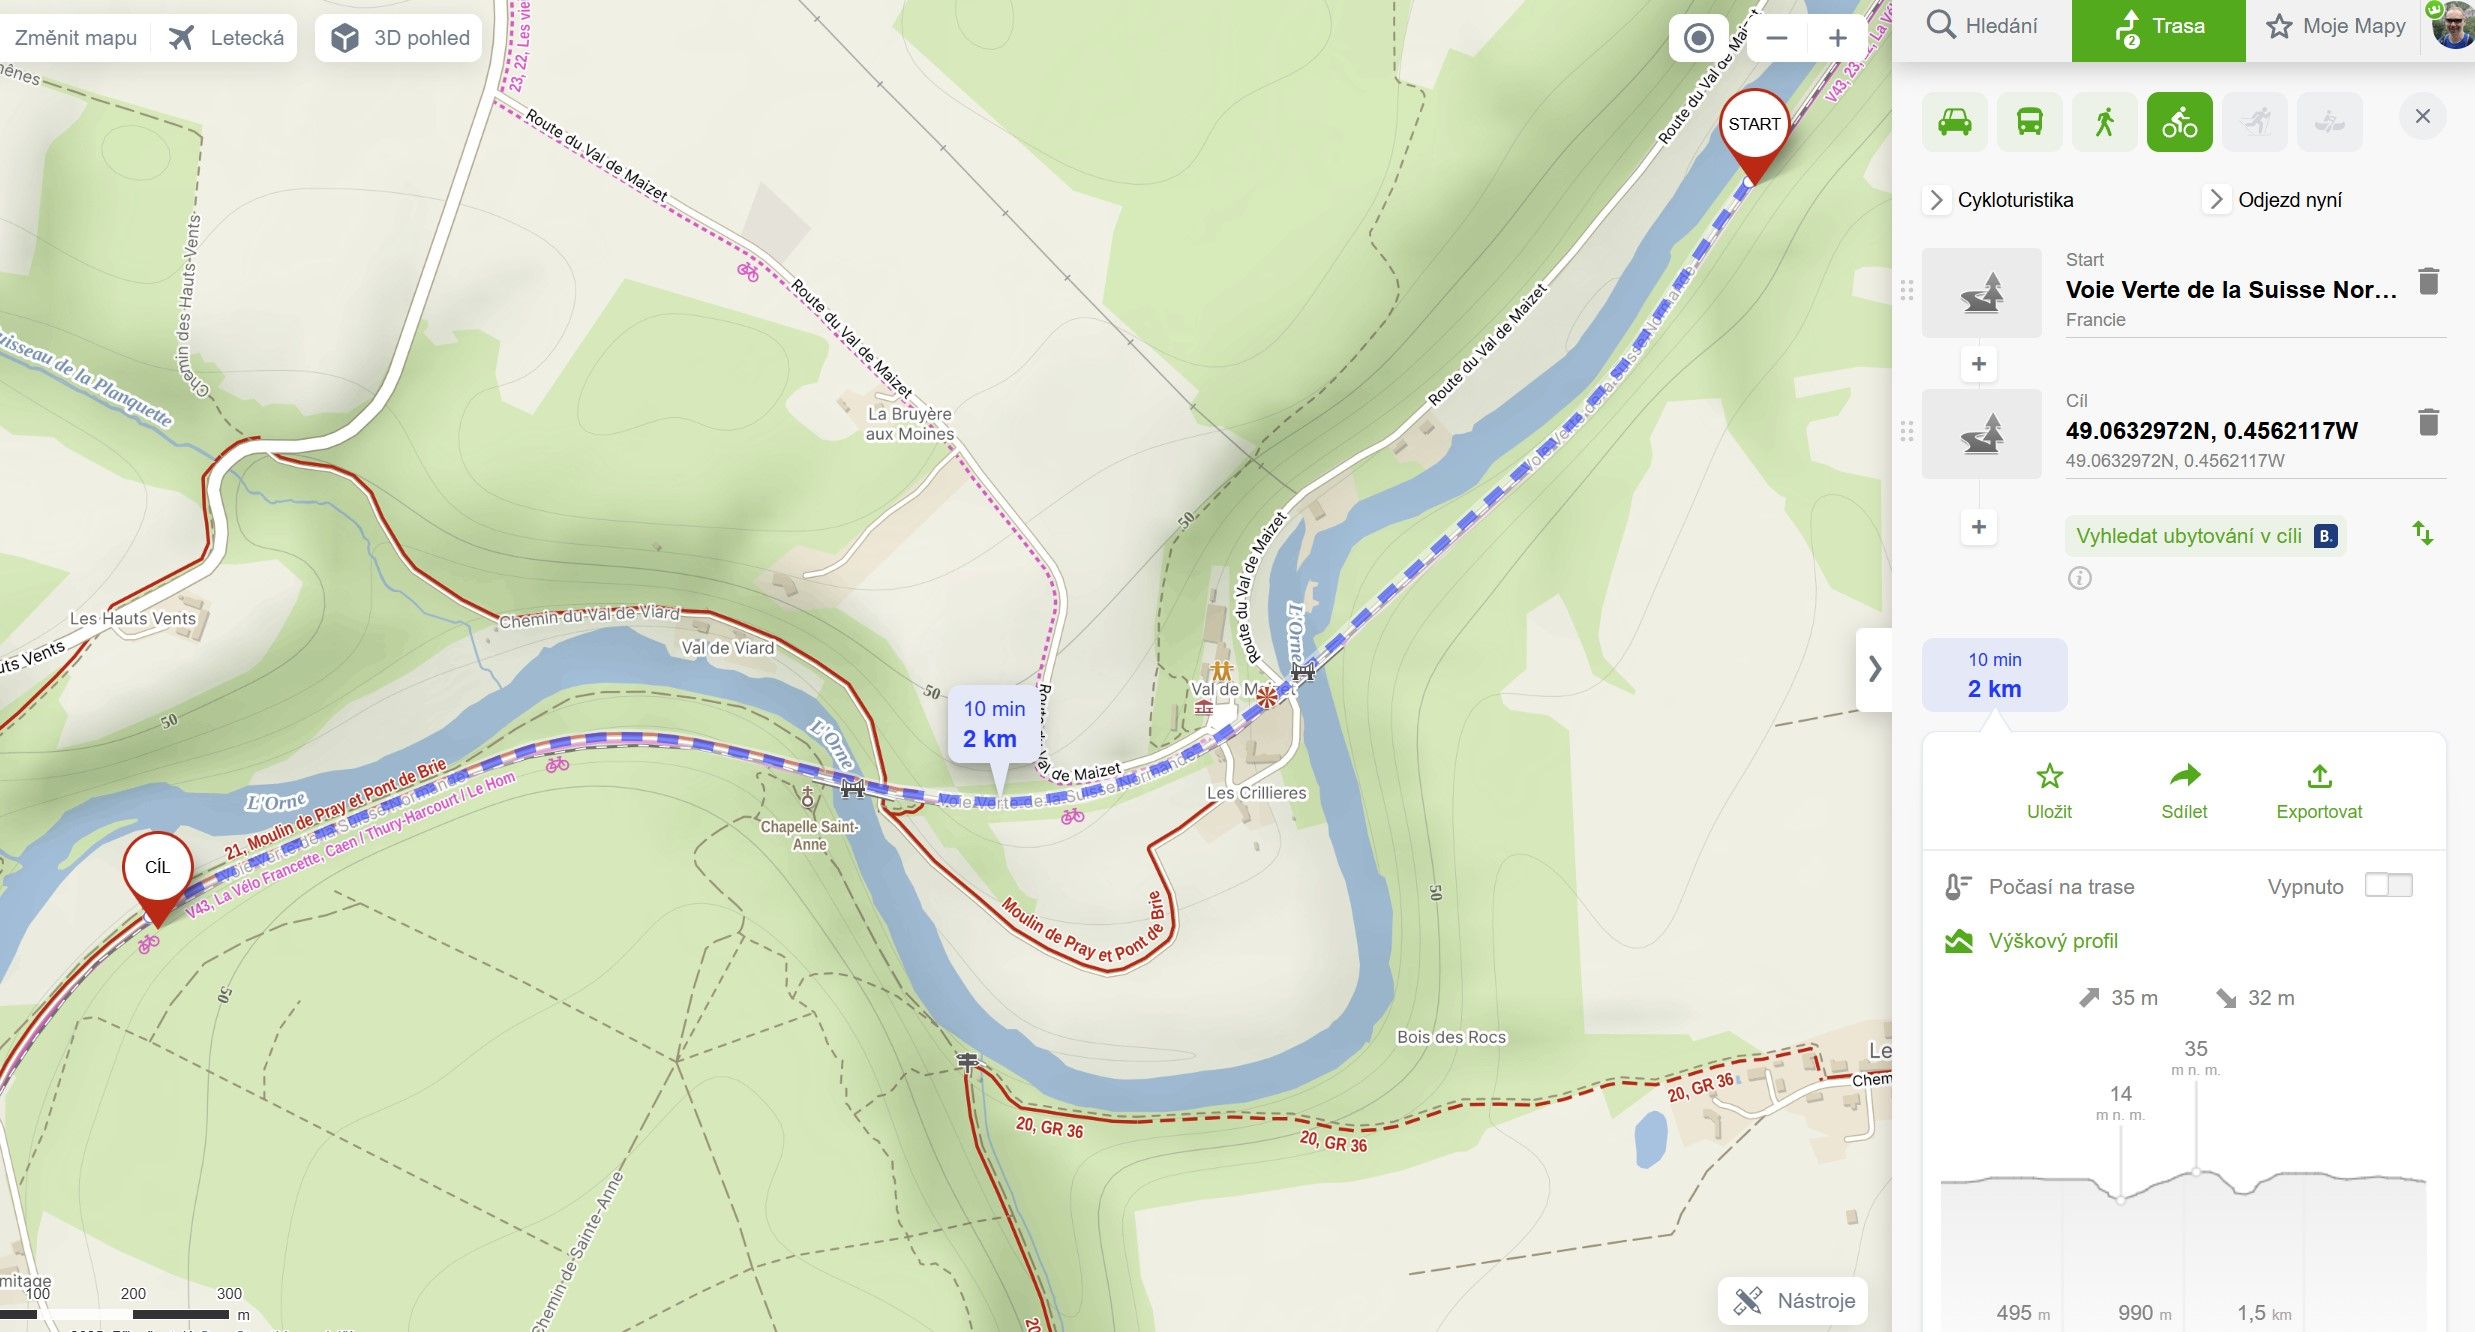
-
@Jan-Buriánek Thank you for spending the time explaining that. Very complete and helpful..When cycling and hitting a shirt uphill bit I wouldn't notice when fresh I'll ponder the algorithms. I do enjoy Mapy
Hello! It looks like you're interested in this conversation, but you don't have an account yet.
Getting fed up of having to scroll through the same posts each visit? When you register for an account, you'll always come back to exactly where you were before, and choose to be notified of new replies (either via email, or push notification). You'll also be able to save bookmarks and upvote posts to show your appreciation to other community members.
With your input, this post could be even better 💗
Register Login